I was recently reading the 1st Blogoversary post over at Sparkling Letters and I realized something:
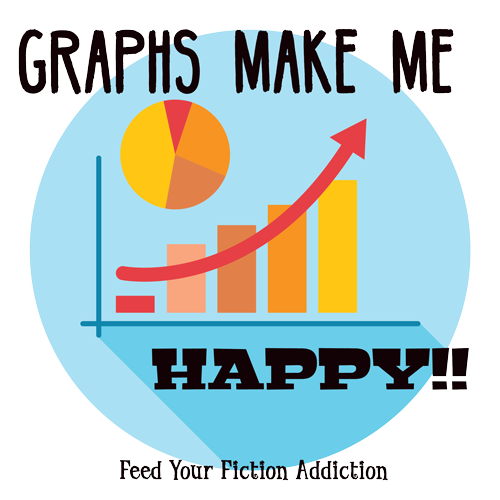
Graphs make me happy!
They just do. Seriously, if I see a post that has graphs in it, I just have to read it—and I gobble them up. I see graphs in someone’s wrap-up post and I perk up and take notice. Even though I’m a completely disorganized person, somehow data in a graph calls to me. It almost doesn’t even matter what the graphs are showing. (Okay, it does matter. I’m not crazy enough to love graphs about boring stuff like the stock market. Butif the graph has anything to do with books, I’m sold.) Somehow putting the information into a graph makes it fun and interesting. Also, adding color to the graphs automatically makes the information that much more exciting.
Case in point: I thought I’d look through my Goodreads stats for the year and make some graphs based on mostly inane stats. It doesn’t matter what I’m tracking—it looks intriguing if it’s presented in a graph.
Alphabetical by Author’s Last Name:
Year Published (and Format):
Number of Pages in Book:
Admit it, even though that information wasn’t all that useful OR entertaining, you checked those graphs out. You did, right? That’s because graphs have an irresistible pull and any resistance to the graphed knowledge is completely futile. I don’t know who invented the graph, but that person was a genius. Whoever you are, person, you have made my life so much sunnier.
In fact, let me express my emotions in a wordcloud:
I guess I should point out that I’m not that excited about actually making graphs. That takes work after all. I mean, I love them once they’re made, but it’s not like I put graphs in all of my posts. (Actually, after I made the graphs for this post, I realized that they take too long to load and they bring up a hoverable thingy to go to Infographics—I’m not all that crazy about that, but I’m not doing them all again in another tool.) But I’m going to try to find the perfect tool and sneak them in more where I can! It’s totally worth the effort!
Are you a graph junkie like me? Do graphs just make you happy somehow? Do you have a fantastic tool that you use to add graphs to your posts? I want to know!


The word cloud cracked me up, haha. Graphs are great but I think I am maybe not quite as in love with them as you are. I did once include a graph in a book review though just for funzies 😛
I might have exaggerated my love of graphs just a little for the sake of the wordcloud, but when I was making the other graphs I saw this and I just couldn’t resist! I actually just went back and added to the post to point out that I’m actually kind of lazy about making graphs, but I love looking at them!
Maybe it’s because I spend days every month doing graphs for work but I would likely not do this myself…they are pretty though ?
Ha! I could see how making graphs for work would make you want to stay away from them on your blog.
I hate math, but I love looking at people’s reading graphs. I have a spreadsheet where I track all my banal and unimportant reading stats. At the end of the year, I turn them into pie charts, and it makes me so happy. My year-end wrap-up posts are my favorite to write because I get to share all my stats.
I’m not big on math either, but graphs transcend my distaste for math somehow.
I’m really digging the circle format you used for number of pages in a book! And yes, I love graphs too. All I do with them though is track my reading with a Google Form that can then make pie charts of the data. That’s what I use for my year end posts.
That circle graph was so much fun, I couldn’t resist it!
How fun! The older I get, the less patience I have for repetitive work that it probably took to put together your wonderful graphs! However, if there was a program that could pull that info and put it into a graph….I’d be all over it! :O)
I do need to try to find the perfect program to make graphs easily.
I got my undergrad in Engineering and my graduate degree is in physical science education. I. Love. Graphs. Graphs can be such an elegant way to present information, when the right type of graph is chosen, and they speak to the visual learner that I am.
Sam @ WLABB
And I’m not a math and science person at all, but graphs still call to me. They’re universal!
Your colorful Graphs definitely make me take notice.
The color makes them much more interesting!
I am so with you. Graphs are just so intriguing. I always have to check them out and see whats going on. I get you though, making graphs is not fun at all, but the end result is amazing! I actually want to use more graphs on my blog because I love them so much but I don’t they’re actually needed for my posts and I’d just be shoving them in there for no reason aha! Great post <3
I always love it when I see someone’s wrap-up with graphs in it. It’s just so satisfying somehow!
As an engineer, I lurve graphs 🙂 🙂
I would imagine you would!
I do really love graphs. I don’t know how well I’d actually do MAKING them – but yeah, seeing them in other posts are fun. 🙂
-Lauren
Yep, that’s about how I feel too. Making them is kind of hard. 🙂
I like graphs and I think they look awesome–I’m just too lazy to put in the effort to make them, haha. I loved reading this post! Thank you for sharing 🙂 I hope you’re having a wonderful weekend!
Brittany @ Brittany’s Book Rambles
I will admit that laziness keeps me from making more of them as well.
Oh I love when you do the graphs!!! I don’t care what they’re about, I just love looking at them!! It was interesting to see the page numbers one. And you’ve read a lot of authors with the last name beginning with “Y”!!
Right? It doesn’t matter what info you’re presenting (as long as it’s about books)—it’s so much more interesting in a graph!
Oh my goodness, we so part ways on this one, Nicole. I don’t know why exactly, but graphs stress me out. Maybe it’s because I tie them to math and I am totally math-phobic. But I’ve never considered graphs something that made me happy. LOL But I do love a good word cloud. 🙂 Maybe I should start to think of graphs only in bookish terms and that will get me over whatever mental block I have about them.:D
Yeah, math was never my thing either, but graphs about books somehow make me very happy indeed!
I am the WORST at graphs, and here is why: I am lazy. That’s it, pure and simple laziness. They are just HARD. First you have to gather allllll the information, and do I have time for that? Who knows. Then you have to organize it, and we all know how great I am at THAT (sarcasm). THEN you have to find the right program to make them- and I think that is the worst part. The ones that are free suck, and there is no way I am paying for it. I do like looking at other people’s graphs though, including yours!! 😀
This is why, even though I say I love graphs, I almost never actually create them. They take forever to make! But I love seeing them in people’s posts and the inclusion of a graph almost guarantees that I’ll read it.
Graphs are so fun! I have been meaning to insert one somewhere, and an inforgraphic. Please someone explain how I can put both into a post and not have it take a week to be good enough to publish. Great post Nicole!
Oh, I know—It’s SUCH a long process to make them. I’d love to give you great advice to make it quick, but … yeah, I got nothing.
Same here! I just love seeing graphs and charts. But what do you call a person like us?